Sanjay Koppikar – CEO, Quadwave
Big Data and Analytics – A brief overview
Have you ever wondered how LinkedIn or Facebook can suggest your long-lost friend as ‘People You May Know’ out of the blue? How do Gmail ads appear on top about almost exactly about what your message says? How does a Google image search or Google Goggle give results exactly the same image out of zillions of images across the globe? How does the Map app on your smartphone know the shortest route across so many roads and how does Google Maps tell you that there may be a traffic jam on the path you are taking? We haven’t even touched the business or military applications yet!
Just a few years back, we were all taught that computers were basically data processing units. Now what we see today does not just seem to be the correct definition any longer. See a 5 year old kid does wonders on a small tab that we could never fathom! Is he still ‘processing data’? We also hear people say that the computers today have become intelligent. Now, are they? How does it impact me as an individual?
The base principles of Computer Architecture hasn’t changed much over the years; however, its implications have; its usability has; size – definitely.
Earlier, (pre-Big data) the concept of Data was more structured. For example, our employee records. Everything was structured information there. When we did “DATA PROCESSING”, we may be searched through this data better/faster, or sorted or categorized it for a report, validated it against some other needs, analysed and/or summarized it for a requirements. That is where the traditional relational databases (RDBMS) such as Oracle, MS SQL Server, MySQL, DB2 and many other thrived and continue to dominate. Here, you can write programs in any language while you connect the databases through connectors like ODBC or JDBC layers. Some of these commercial DB servers also came up with reporting services apart from many different offerings. But base thought process was similar.
But, as computer usage started growing and as usage patterns started changing, this data no longer meant only structured. The human need for information started changing.
The basic definition of even ‘Computer or PC’ itself started changing with our mobile phones and our TVs have become smarter with multi-core processors running in it. We now have processors in everything including our cars as well. This power in terms of CPU clock speed, RAM size, Hard disk etc – just few years back we only expected a Server to have! And guess what, with Internet of Things (covered little later in this article) these trends will continue – virtually everything around starts becoming a part of computer.
Once this happened and the consumer started carrying multiple ‘computers’ in different forms in their pockets, cars, TVs and on their dining table, the need of data processing started changing. There was no structure and quantity limitations for this data.
That is where the role of Big Data started. It is a broad term for large set of data that the normal RDBMS we spoke about struggled to deliver or handle. Even the data type started becoming too many from traditional stuff. Photos, hand-written notes, tweets, emails, my Facebook status update, a YouTube video, Google Search, geographical position, and piece of map – virtually anything started becoming part of this need for data. Consumers of these data started demanding these.
It was no longer just giving the data to you – no longer the traditional Garbage In Garbage Out (GIGO) any more. We wanted the computers to deliver us the information processing this large amount of data through capturing, curating, searching, sharing, storing, visualizing, analyzing while protecting my personal data and integrity!
Let us get a perspective to what I mean.
Facebook has more monthly users (1.32 billion) than India-the world’s second-most populous country-has people (appx 1.24 billion). According to the online tech mag, TechCrunch, Facebook’s system processes 2.5 billion pieces of content and 500+ terabytes of data each day. It’s pulling in 2.7 billion ‘Like’ actions and 300 million photos per day, and it scans roughly 105 terabytes of data each half hour. Within this, it has to maintain people’s preferences, security, categorization (groups and others), followers, and most importantly send relevant ads to generate revenues.
Or we could take another example and see how it works:
As mentioned earlier, if you are user of Google Maps on your smart phone or any GPS device, you will know the benefit of Traffic indicator it has. Google Map gives real-time traffic updates on major roads and highways for nearly 50 countries! It consolidates multiple sources such as other Google Map users, Android based phones and many other sources. By calculating the speed of users along a stretch of road, Google is able to generate a live traffic map. Google processes the incoming raw data about mobile phone device locations. When a threshold of users in a particular area is noted, the overlay along roads and highways on the Google map changes colour to indicate rush!
In this way, slowly and steadily Big Data and its analytics is slowly changing user behaviour and impacting many things in our lives.
How does it actually work?
Many of these solutions are based on free and open source framework written by many developers contributing across the globe. Some of these are provided by Apache Software Foundations’ Hadoop, Nutch & Lucene.
In the mid-nineties, the concept of distributed algorithms became more applicable, especially after the Internet was made available to public. Today, MapReduce takes a major share in this concept. MapReduce is a programming model for processing and generating large data sets with a parallel, distributed algorithm on a cluster of computers. Apache Hadoop was primarily built on this and Google search has been using it extensively from a long time. In fact, their extensive work on this and their research on large scalability has made Google the company that it is today.
Today, different ports and extensions of these base products have come out by extending the focus of real-time analytics and search, and other such processing on large and specific data sets is being made faster and better. SOLR (pronounced, Solar) and Apache Spark are some of the examples of this.
It is not that these platforms help solve all the problems. These only provide the base architecture to either store, retrieve/search or process the data. However, effective applications have to be written around them to build a specific business application. For example, SOLR is a popular open source search engine that can do a full text search, real-time indexing, clustering, database integration and even handle documents of different formats such as MS Word, PDF among others. However, the specialised software engineers and experts participate in tweaking and using this base to convert business specific applications for business owners and analysts.
How do we leverage these analytics in real life scenarios?
Technology has always been an enabler for business. Analytics and data-driven decision making have been well recognized as a distinctive competitive advantage. However, large businesses are challenged with scaling in a world of Big Data and increasing business complexities while using analytics and making it an integral part of all business decisions.
The field of Data management has grown in specializations such as:
- DB Administration
- Data Governance
- Data Warehousing & BI
- Data Quality Management
- Data Architecture & Design
- Unstructured Data Management
- Online Transaction Processing (OLTP)
- Information presentation and Dashboards
Today, most of the leading organizations across multiple industry verticals use these technology platforms to solve their high impact business problems in different horizontals such as finance, marketing, competitive analysis, risk management, supply chain and many more. In fact, it has given rise to different verticals for analysts to grow in terms of Data Engineering, Decision Sciences or Data Science.
There are many data scientists who have made their way in to large enterprises employing techniques and theories drawn from many fields within the broad areas of mathematics, statistics, and information technology, including signal processing, probability models, predictive analysis, visualization, machine learning and many others. Data scientists should be spending time and brainpower on applying data science and analytic results to critical business issues – helping an organization turn data into information – information into knowledge and insights – and valuable, actionable insights into better decision making and game changing strategies. A data scientist team include Business Architects, Data Architects, Data Visualizers and Data Change Agents.
Data engineers are the designers, builders and managers of the information or “big data” infrastructure such as SOLR, Spark etc. They develop the architecture that helps analyse and process data in the way the organization needs it. And they make sure those systems are performing smoothly. The data engineer gathers and collects the data, stores it, performs batch processing or real-time processing, and serves it via an API (to external programs, tools) or to a data scientist who can easily query it.
How does it help in business management or administration?
Being in business management, Big Data related analytics open up a new horizon across different verticals or horizontals of the focus area/domain.
Say, in marketing as a horizontal, sentiment analytics, for example, plays an important role in understanding the mood of the public – for a geography or beyond. This is used effectively by large companies to market the right product or do a course correction through better PR activities. I strongly suspect, in recent elections in India, this was also used to analyse and change or impact certain user opinions using social networks and online portals as effective marketing tools.
Let us see how this works. Let us take a relatively non-controversial subject as Obama’s visit to India during India’s Republic Day parade.
For those few days, Social Media was abuzz with a lot of activities. Do you know how?
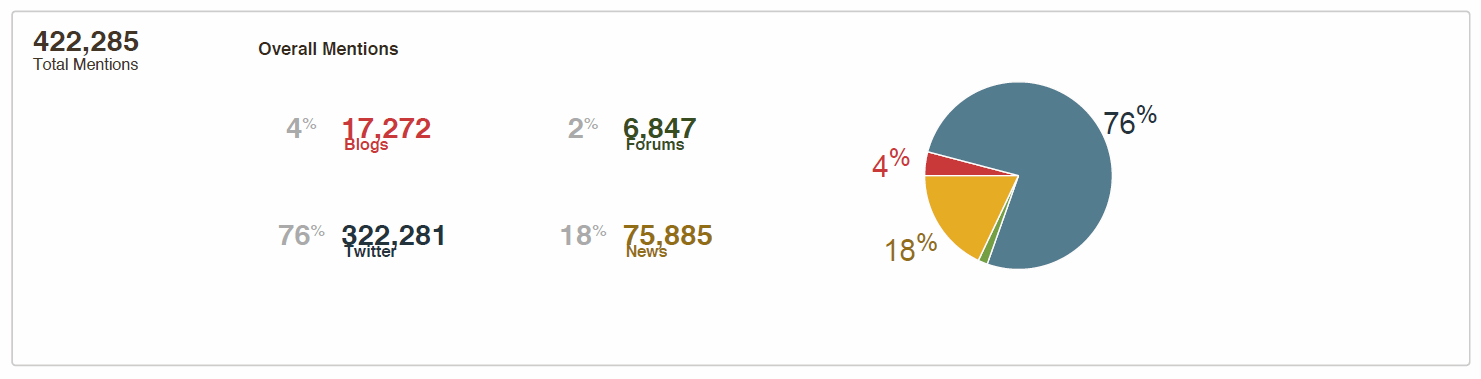
During this period, a whopping 400k mentions across different social networks emerged. Tweets leading the way and news media came a distant second.
Let us see, how the sentiments in each blog were:
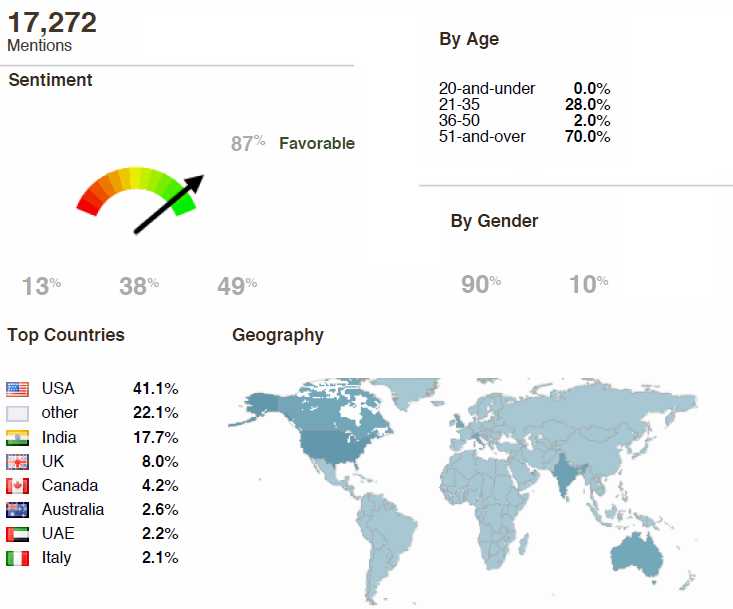
If you notice the above picture carefully, the overall sentiments expressed are positive. These analyses are being made through the use of analysing the tone of the language used in these tweets, blogs etc.
Now this becomes an important aspect to know if you are in marketing. If the sentiments are negative for your product, client or a theme, you will get an opportunity to act or create marketing initiatives to impact a change in this trend and continue to monitor the trend to validate the effectiveness of the marketing campaign.
Let us see how we got Twitter to behave on this:
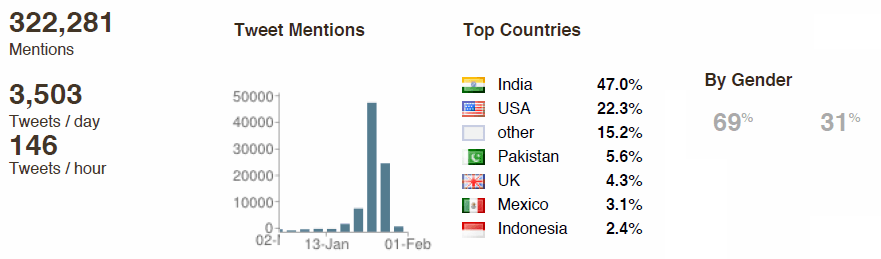
The above shows the geography of the impact area. In a marketing team context, you know the geography where you need to take action.
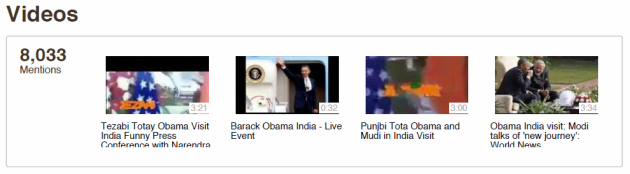
How about Videos during these days?
How one can use this information? It’s simple. You know the cause, you know the symptoms and you know the affected area – now you need to solve the problem! That is where the target based consumption comes in place. The detailing could go down to each tweet, each status that is put there on the web!
There are large companies who build these analytic systems and there are vertical analytics companies that render these services to different companies. For example, there are analytics companies that analyse the video ads that come on different channels and provide competitive analysis to their customers. For example, if one brand’s soap ads are featured at different geography specific channels – the video based analytics companies can capture, identify, analyse and provide information to their customers where they can plan their marketing strategies to counter it.
In the field of medicine, as a vertical, big data analytics is already bringing in a paradigm shift in the way doctors are treating the patients. This is just the beginning.
Generally we know that non-communicable diseases are due to genetics or lifestyle. And genetically ‘acquired’ diseases are pro-actively tracked and if attended to earlier as a DNA analysis would reveal the possibilities. The human genome is the complete set of genetic information for humans. This information is encoded as DNA sequences within the 23 chromosome pairs in cell nuclei and in a small DNA molecule found within individual mitochondria. But a single DNA is difficult to see and manage. Billions of DNA molecules together can make this much better. But do we know that even though there are 3.2 billion bases for human genes, there are less than 20,000 protein coding genes? This is a big combination of things – a typical ingredient for a Big Data solution.
This means, if there are enough simulations of these available, there will be a time when doctors of the near-future would be treating you a genome based approach than a typical pathological approach for many ailments.
Already, the big data analytics are in effective use in many areas such as military and security purposes where a large amount of voice, SMS, instant messaging, and many other systems are analysed to provide a pro-active information to the intelligence agencies of a country to intercept and prepare for any eventualities such as terrorist attacks.
A banking transaction leading to some fraud means that there are fraud detection systems in place with many large banks (including some in India as well). They identify using a pattern based approach on zillions of transactions and identify the possible frauds.
Stocks and shares market have been using such systems from early days. These analyse different news and events leading to predictions of how these pointers may impact the share prices.
A futuristic Google Car – a driverless one at that, is able to process huge number of images taken through its rotating camera mounted on its top – connecting to satellite or through a mobile connection to provide routing guidelines to reach the destination safe and sound. However, its effectiveness needs to be validated in Delhi or Bangalore traffic chaos!
This is how the future of mankind looks like with the impact of the Big Data and its analytics.
Sources:
- Wikipedia
- Techcrunch.com
- Quadwave.com’s Analytics systems